Interactive Maps with tmap and Shiny

Session 3: Legends and other map components

Martijn Tennekes

What are map components?

Map components — overview

Map components are non-spatial elements added to the map — they have no geographic location and can be placed anywhere on the canvas.

Examples: - Legends - Title - Compass - Scalebar - Credits / attribution text - Inset maps and graphics - Charts, minimaps, mouse coordinates

Which components work in which mode?

Run tmap_overview() to see what is available per mode:

tmap_overview()
  • Data layers (tm_polygons, tm_lines, …): work in both "plot" and "view" mode
  • Auxiliary layers (tm_basemap, tm_tiles, …): work in both modes
  • Map components: mixed — many are plot-mode only

Component mode support

Component plot view
tm_scalebar
tm_compass
tm_title
tm_credits
tm_legend
tm_minimap
tm_mouse_coordinates
tm_chart
tm_inset
tm_logo

Most of this session is plot-mode focused

tmap’s layout and design system — the positioning framework (tm_pos_in, tm_pos_out, tm_components), frames, background colours, panels, styles, and inset maps — is built with plot mode in mind. It offers a rich, publication-grade design toolset.

In view mode, most of these features are either unavailable or simplified. For example, component positioning is reduced to one of the four corners of the map.

We cover the view-mode components at the end of this session.

Map components (plot mode)

Title

library(tmap)

tm_shape(World) +
  tm_polygons("gender",
    fill.legend = tm_legend(title = "")) +
tm_crs("auto") +
tm_title("Gender Inequality Index")

Compass, scalebar, and credits text

tm_shape(NLD_muni) +
  tm_polygons("income_high") +
tm_compass() +
tm_scalebar(breaks = c(0, 10, 25, 50)) +
tm_credits("(c) Statistics Netherlands, 2022")

Inset map

bb_ams = tmaptools::bb("Amsterdam")

tm_shape(NLD_dist) +
  tm_fill("income_high") +
tm_shape(NLD_muni) +
  tm_borders(lwd = 1) +
tm_shape(NLD_prov) +
  tm_borders(lwd = 3) +
tm_inset(bb_ams)

Inset map

Positioning of components

Positioning — overview

Two levels of control:

  1. Shortcut method — character or numeric vector; quick and sufficient for most cases
  2. Main methodtm_pos_in() and tm_pos_out() for precise control

Shortcut method

# Character shortcut — inside the map frame
tm_compass(position = c("left", "bottom"))

# Uppercase — inside but tight against the frame edge
tm_compass(position = c("LEFT", "BOTTOM"))

# Numeric (0,0) = bottom-left, (1,1) = top-right
tm_compass(position = c(0.2, 0.2))

Example of shortcut positioning

tm_shape(NLD_muni) +
  tm_polygons("grey85", col = "grey60") +
tm_compass(position = c("left",  "top")) +
tm_scalebar(position = c("right", "bottom")) +
tm_credits("(c) CBS", position = c(0.2, 0.2))

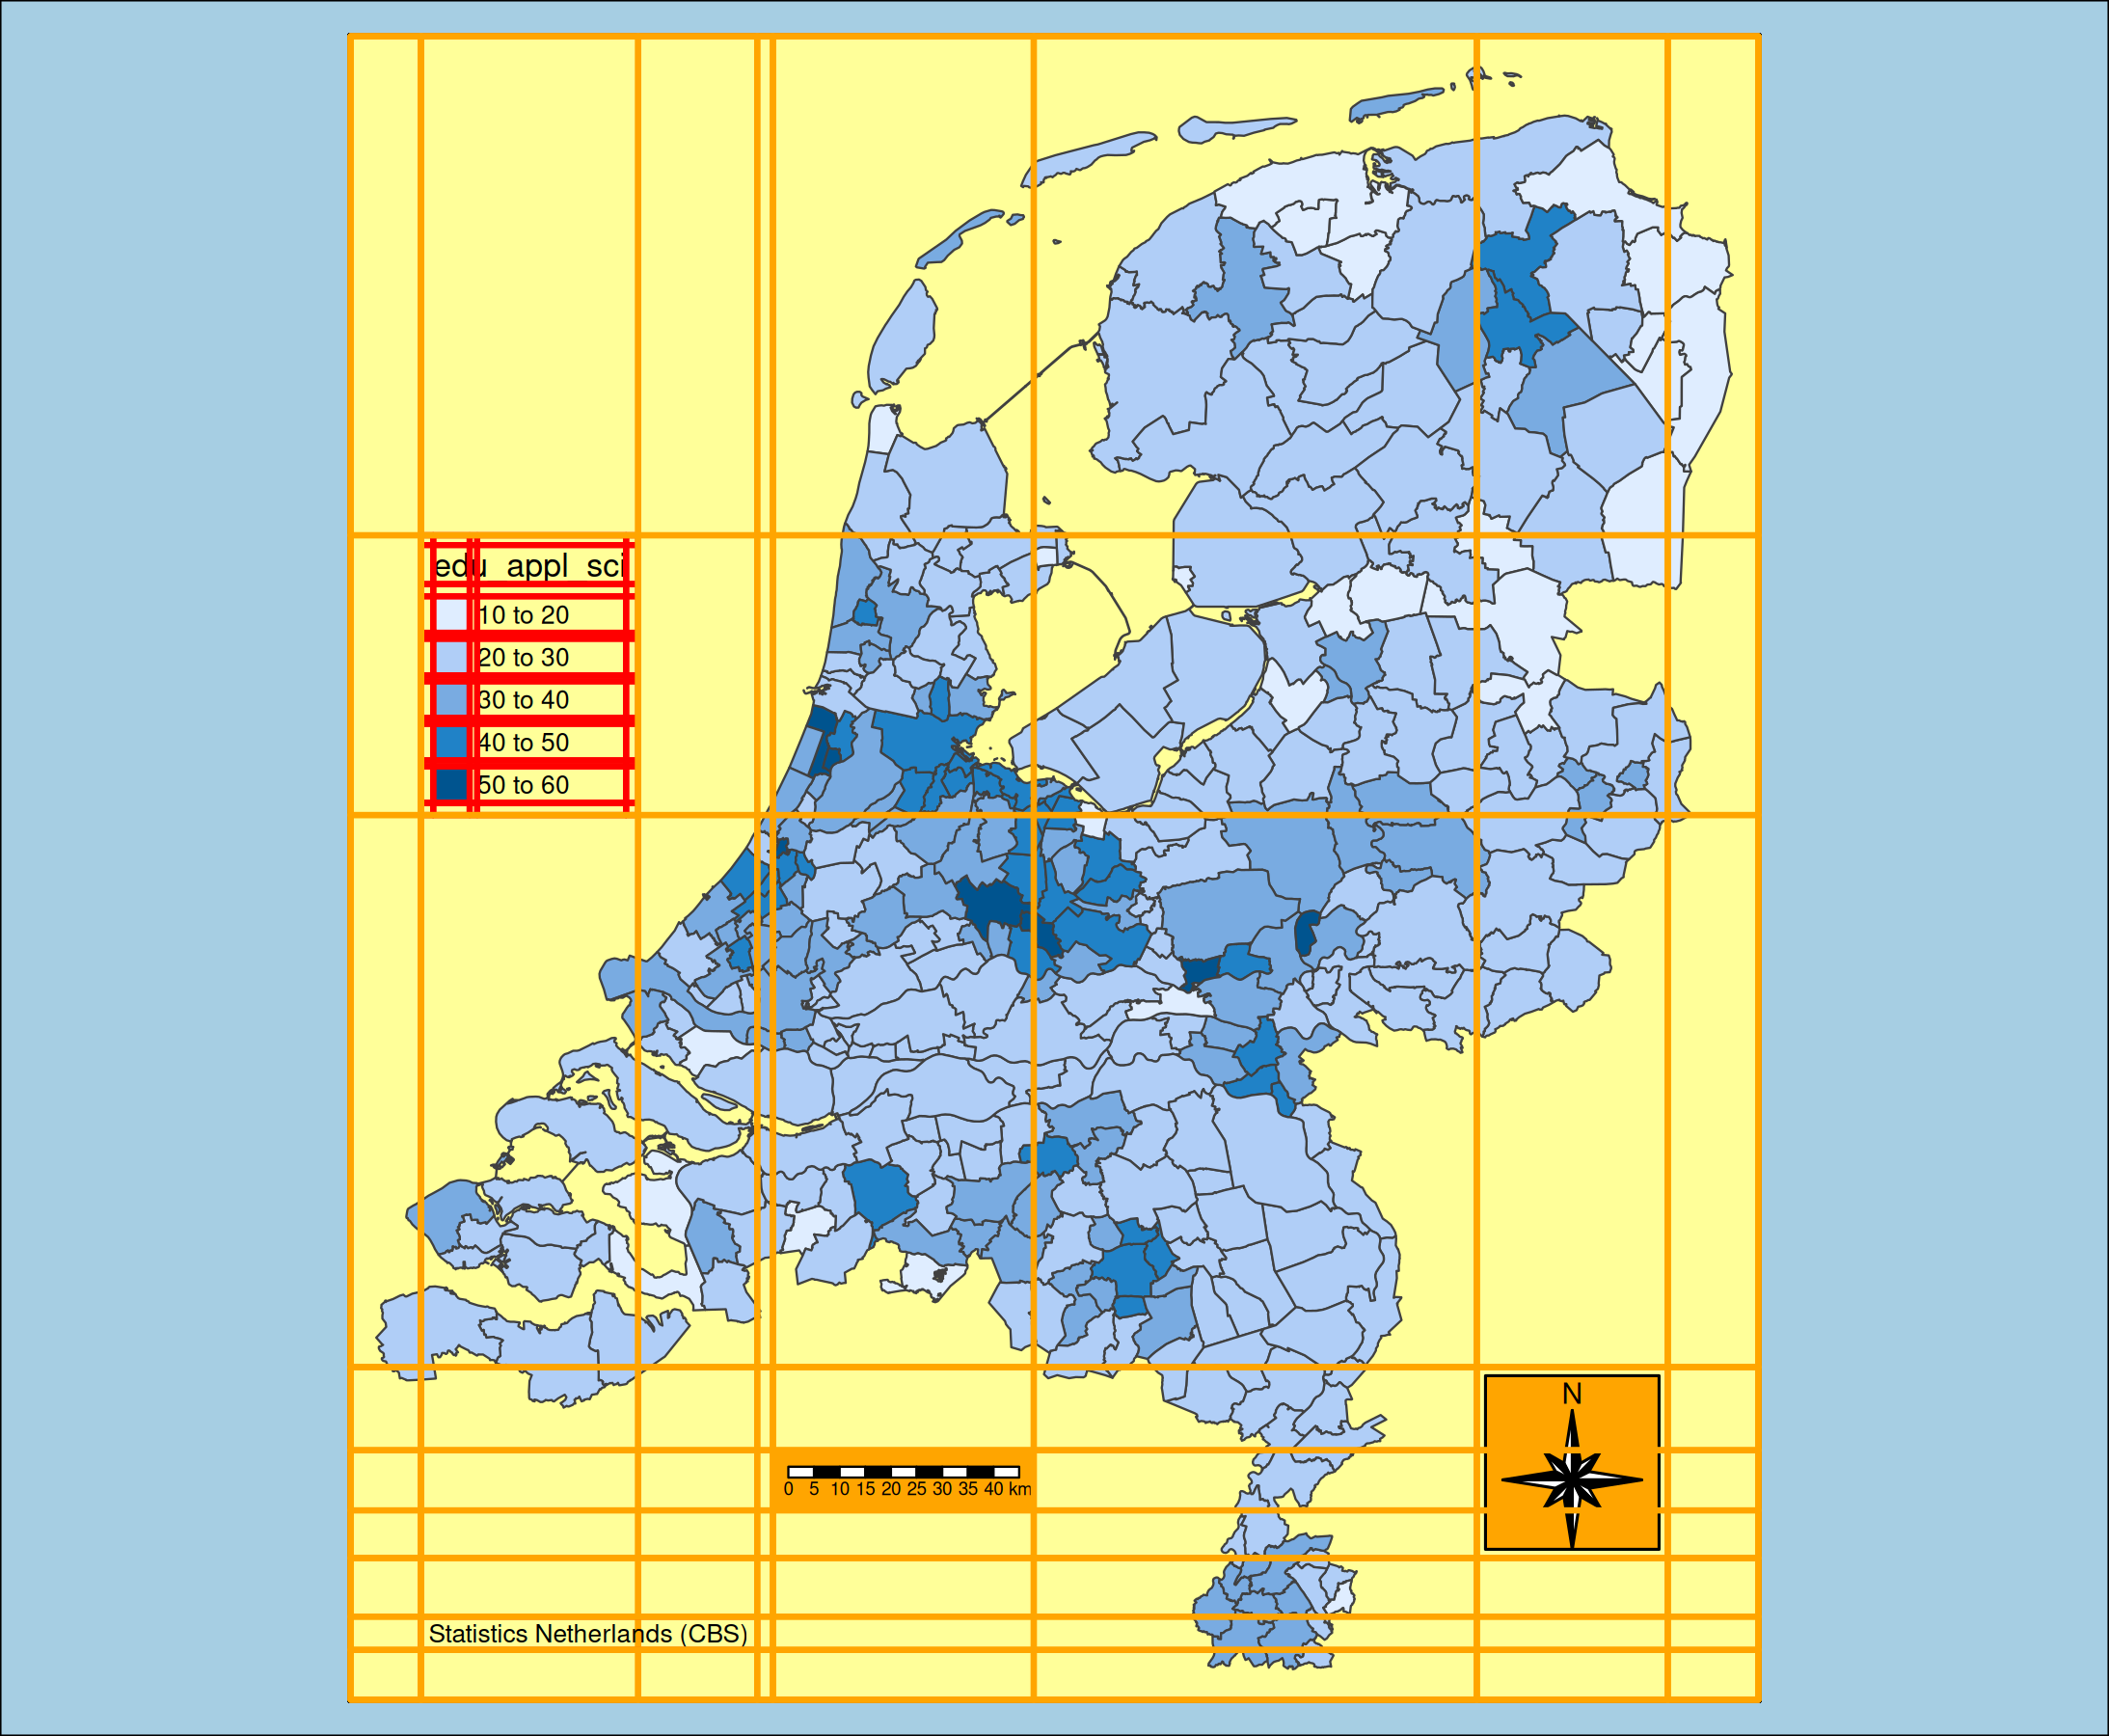
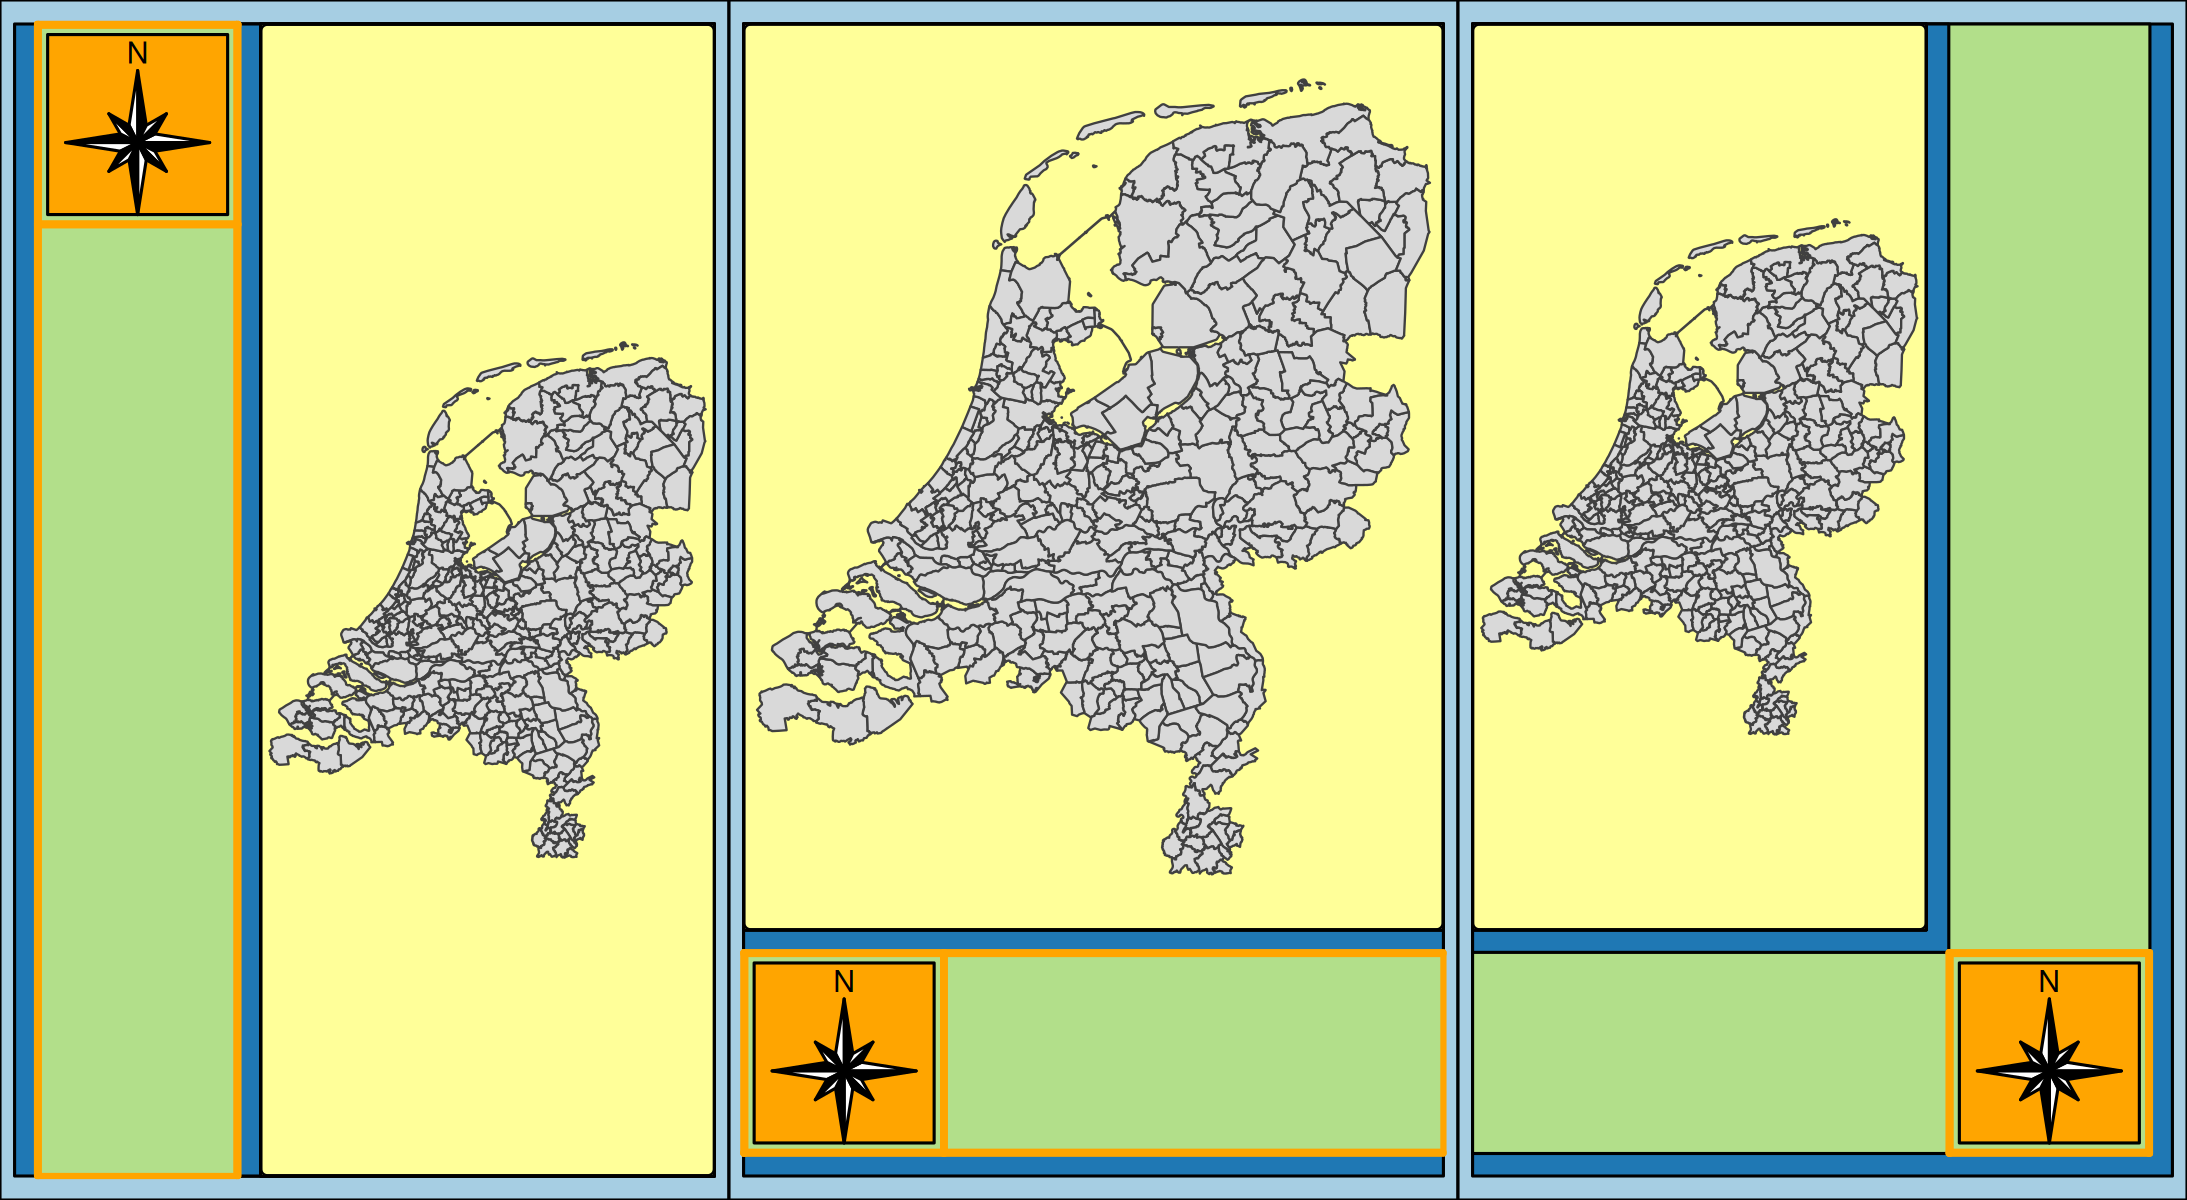
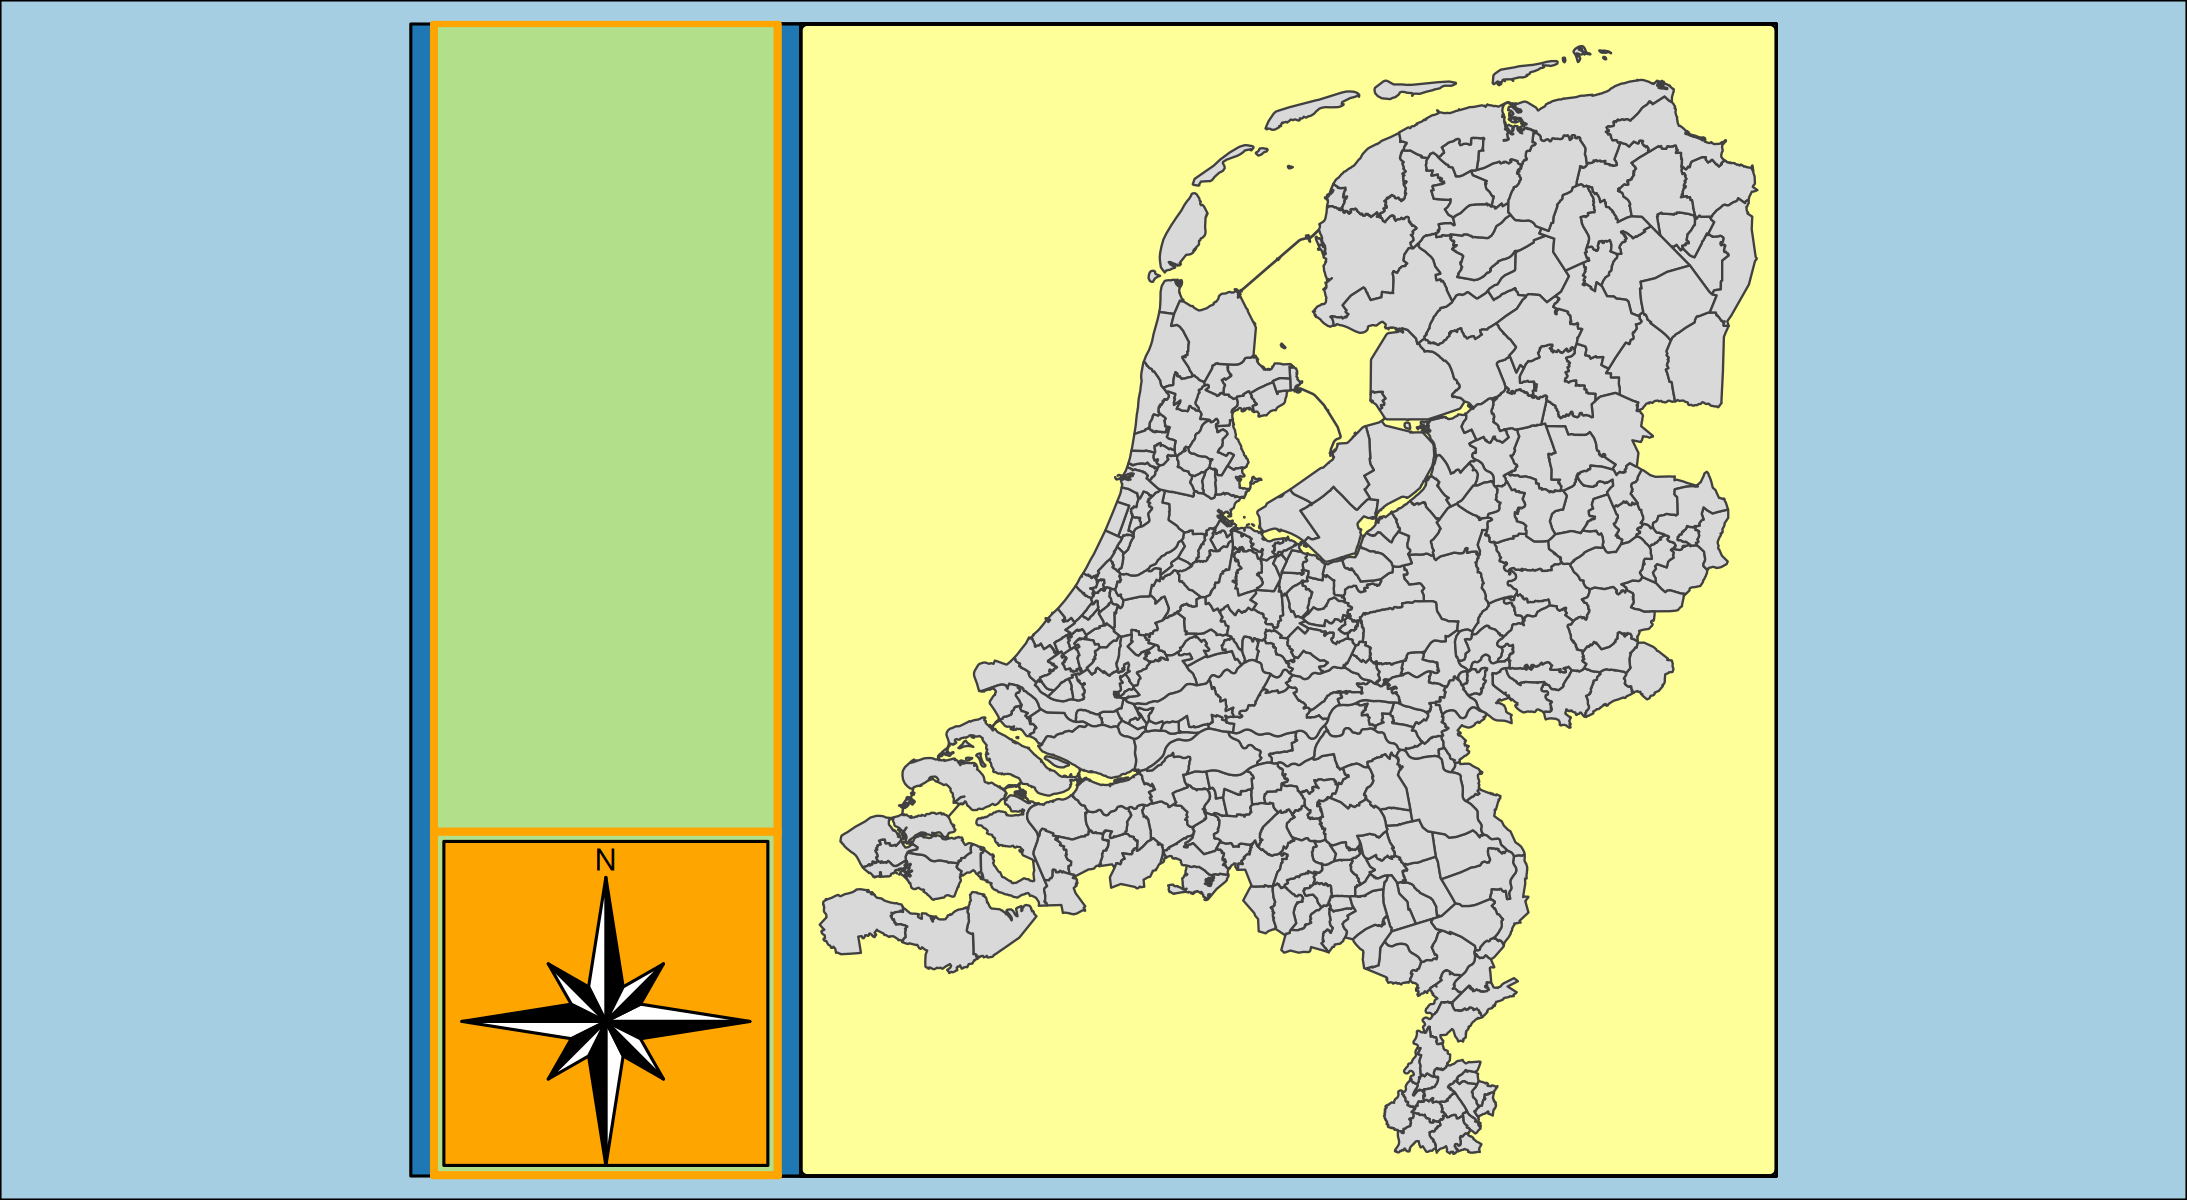
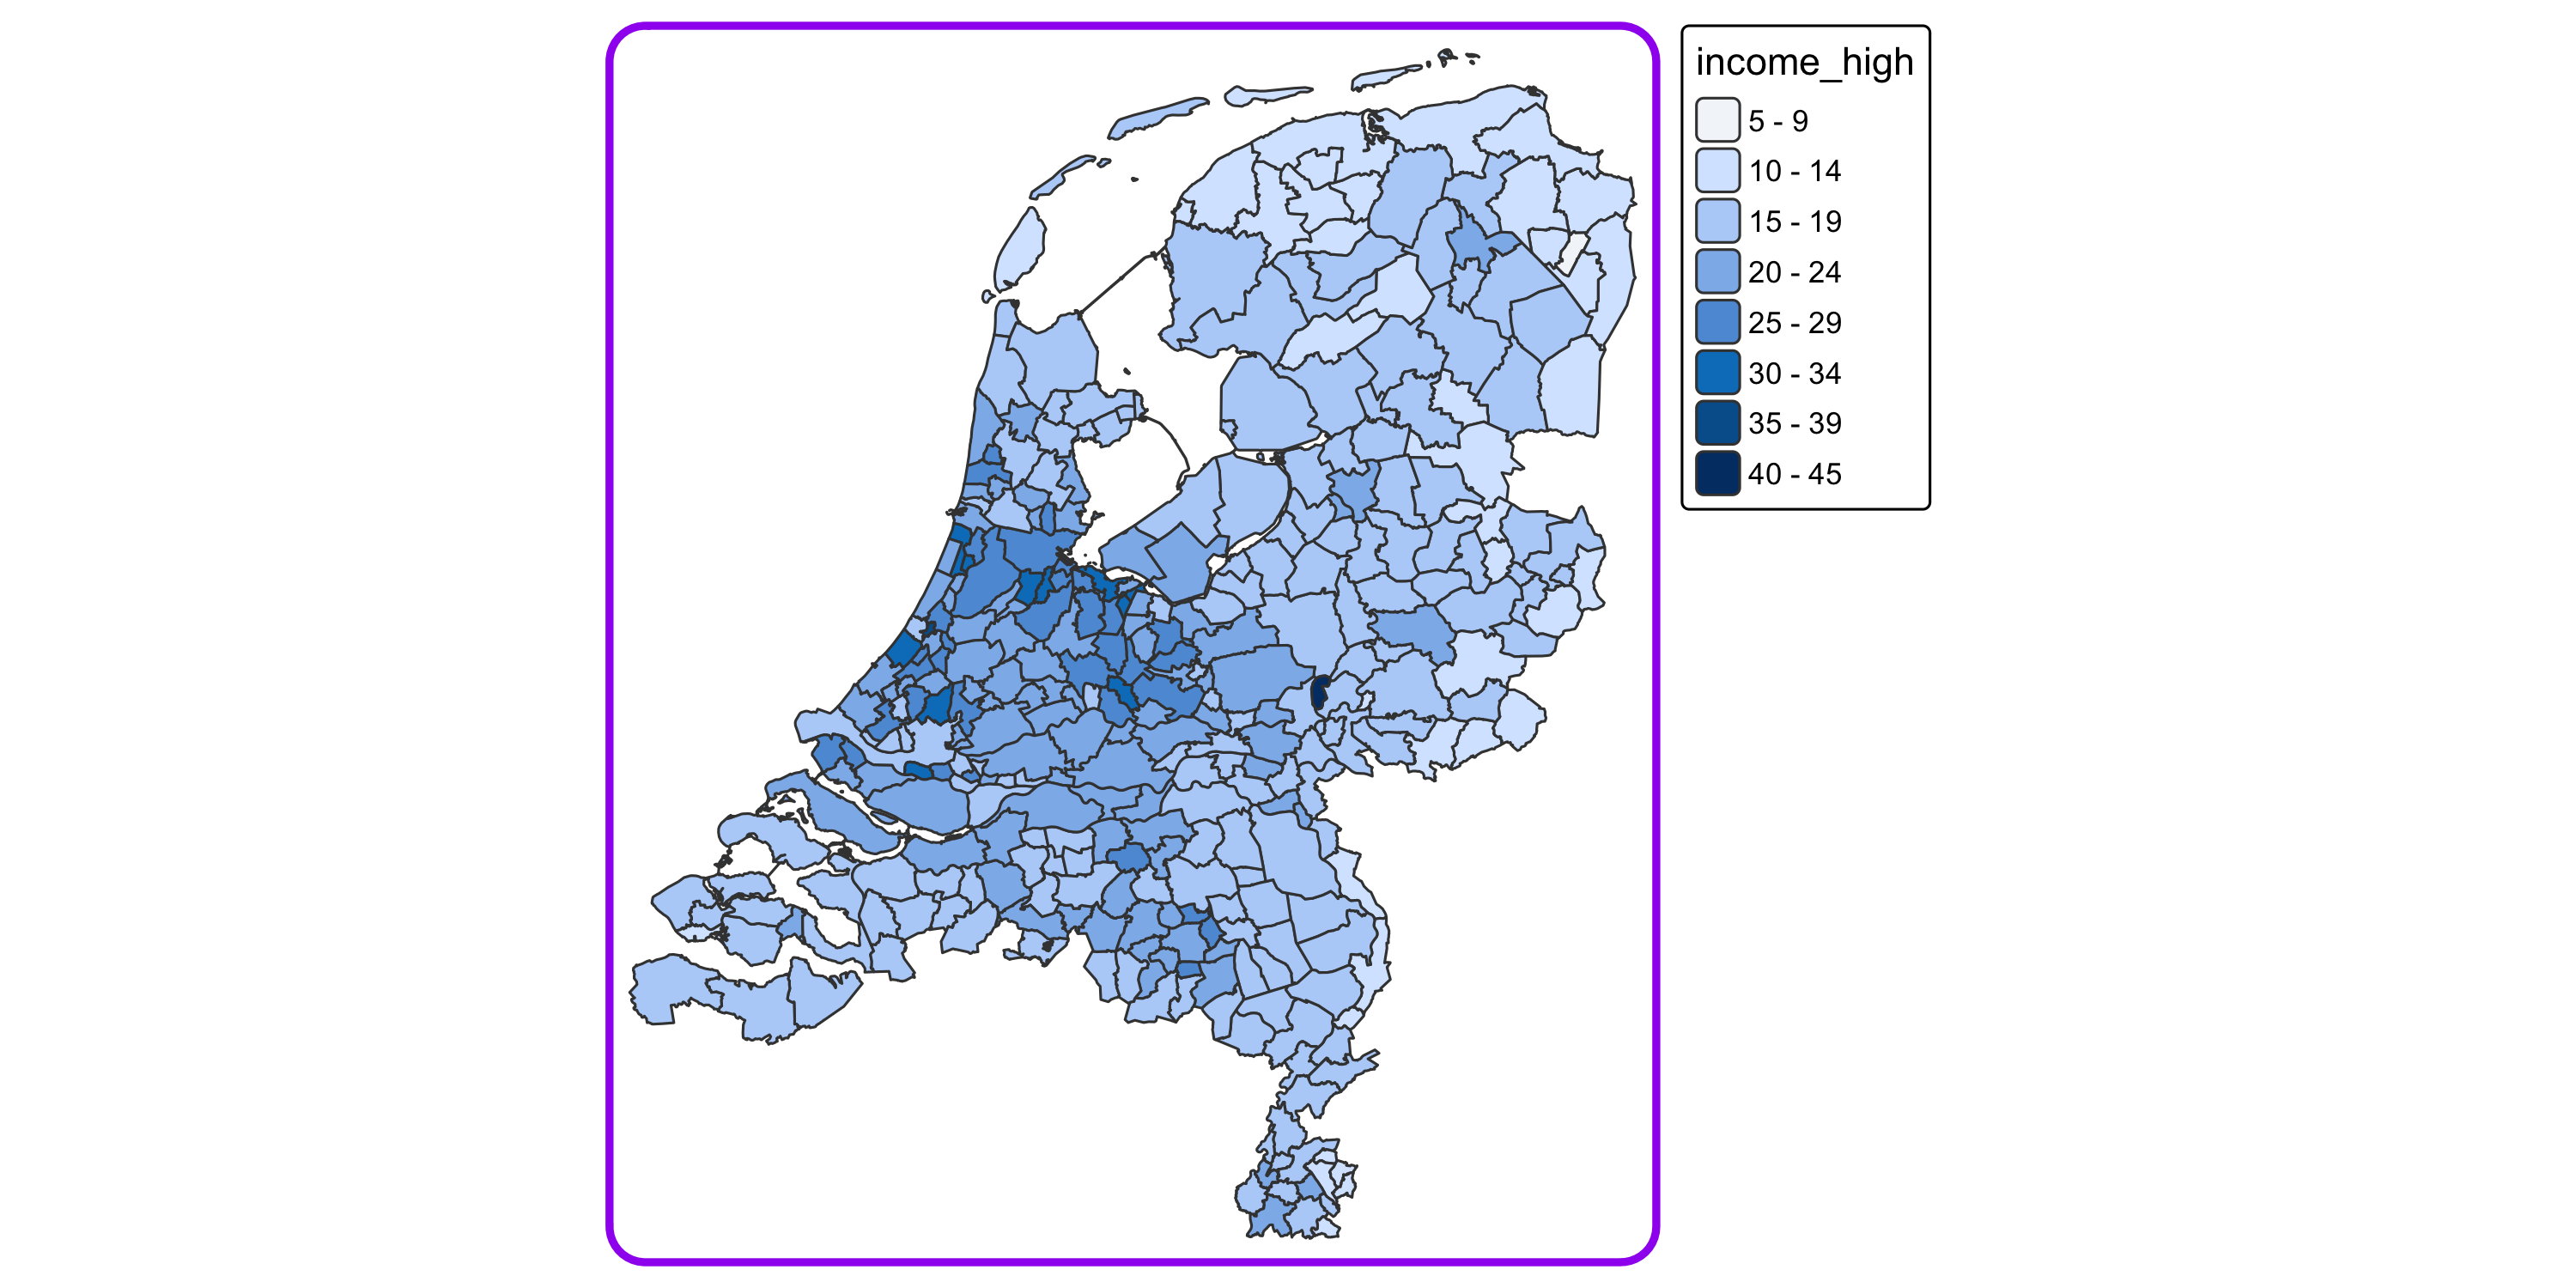
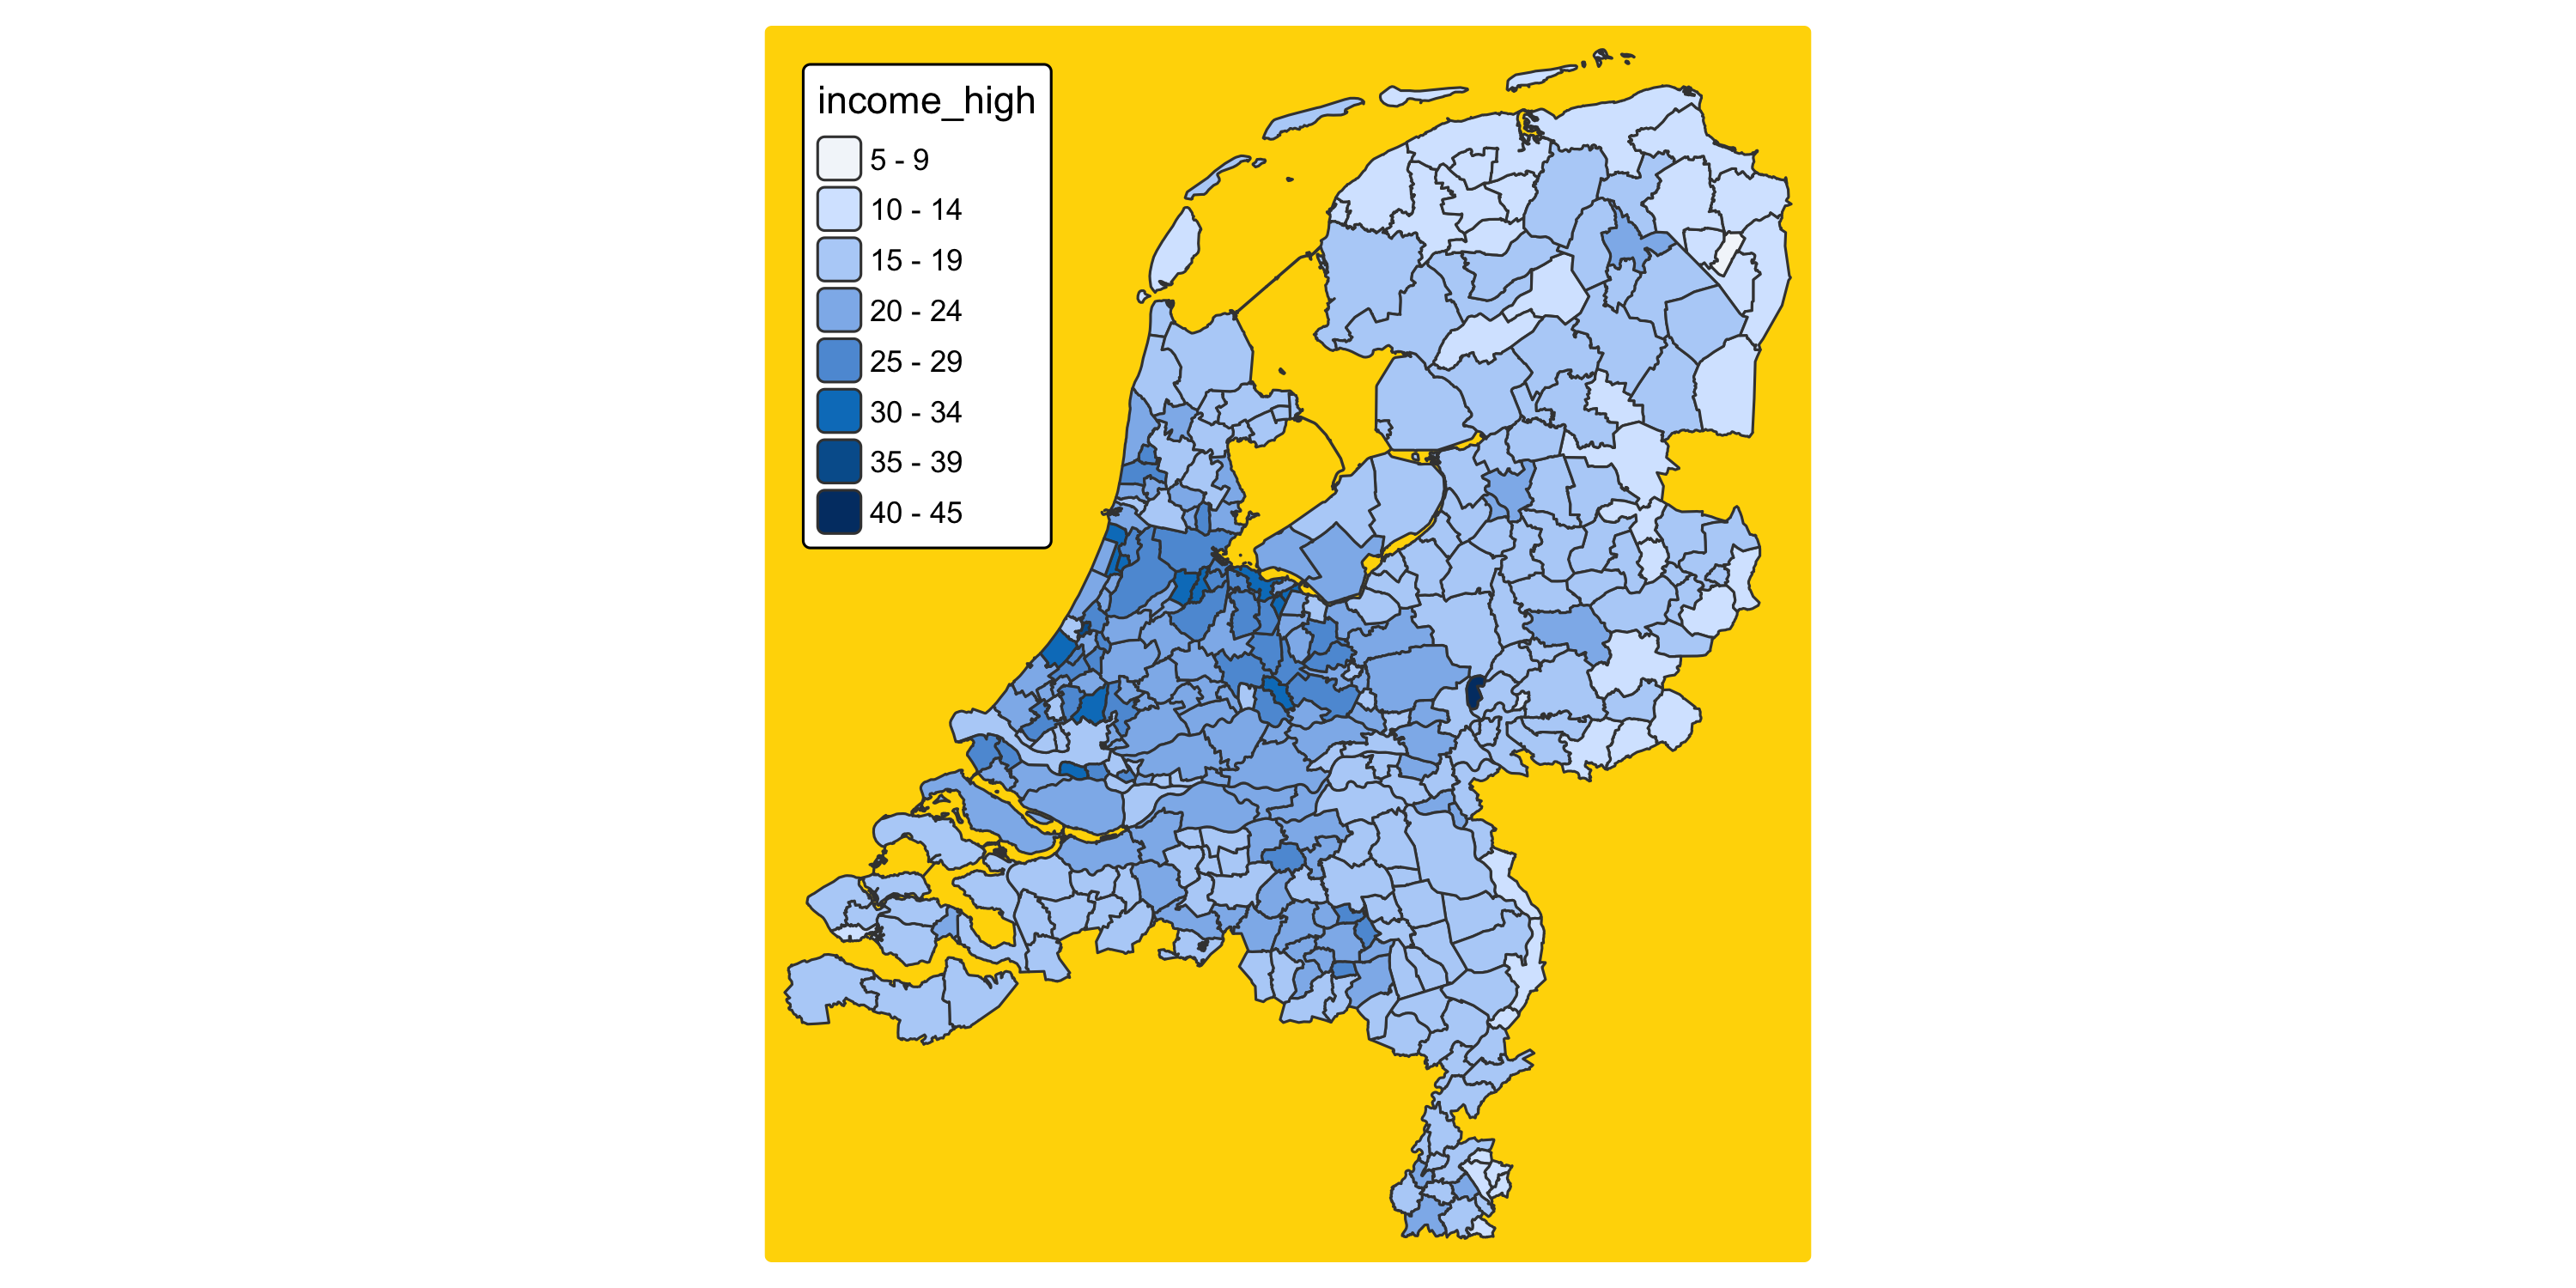
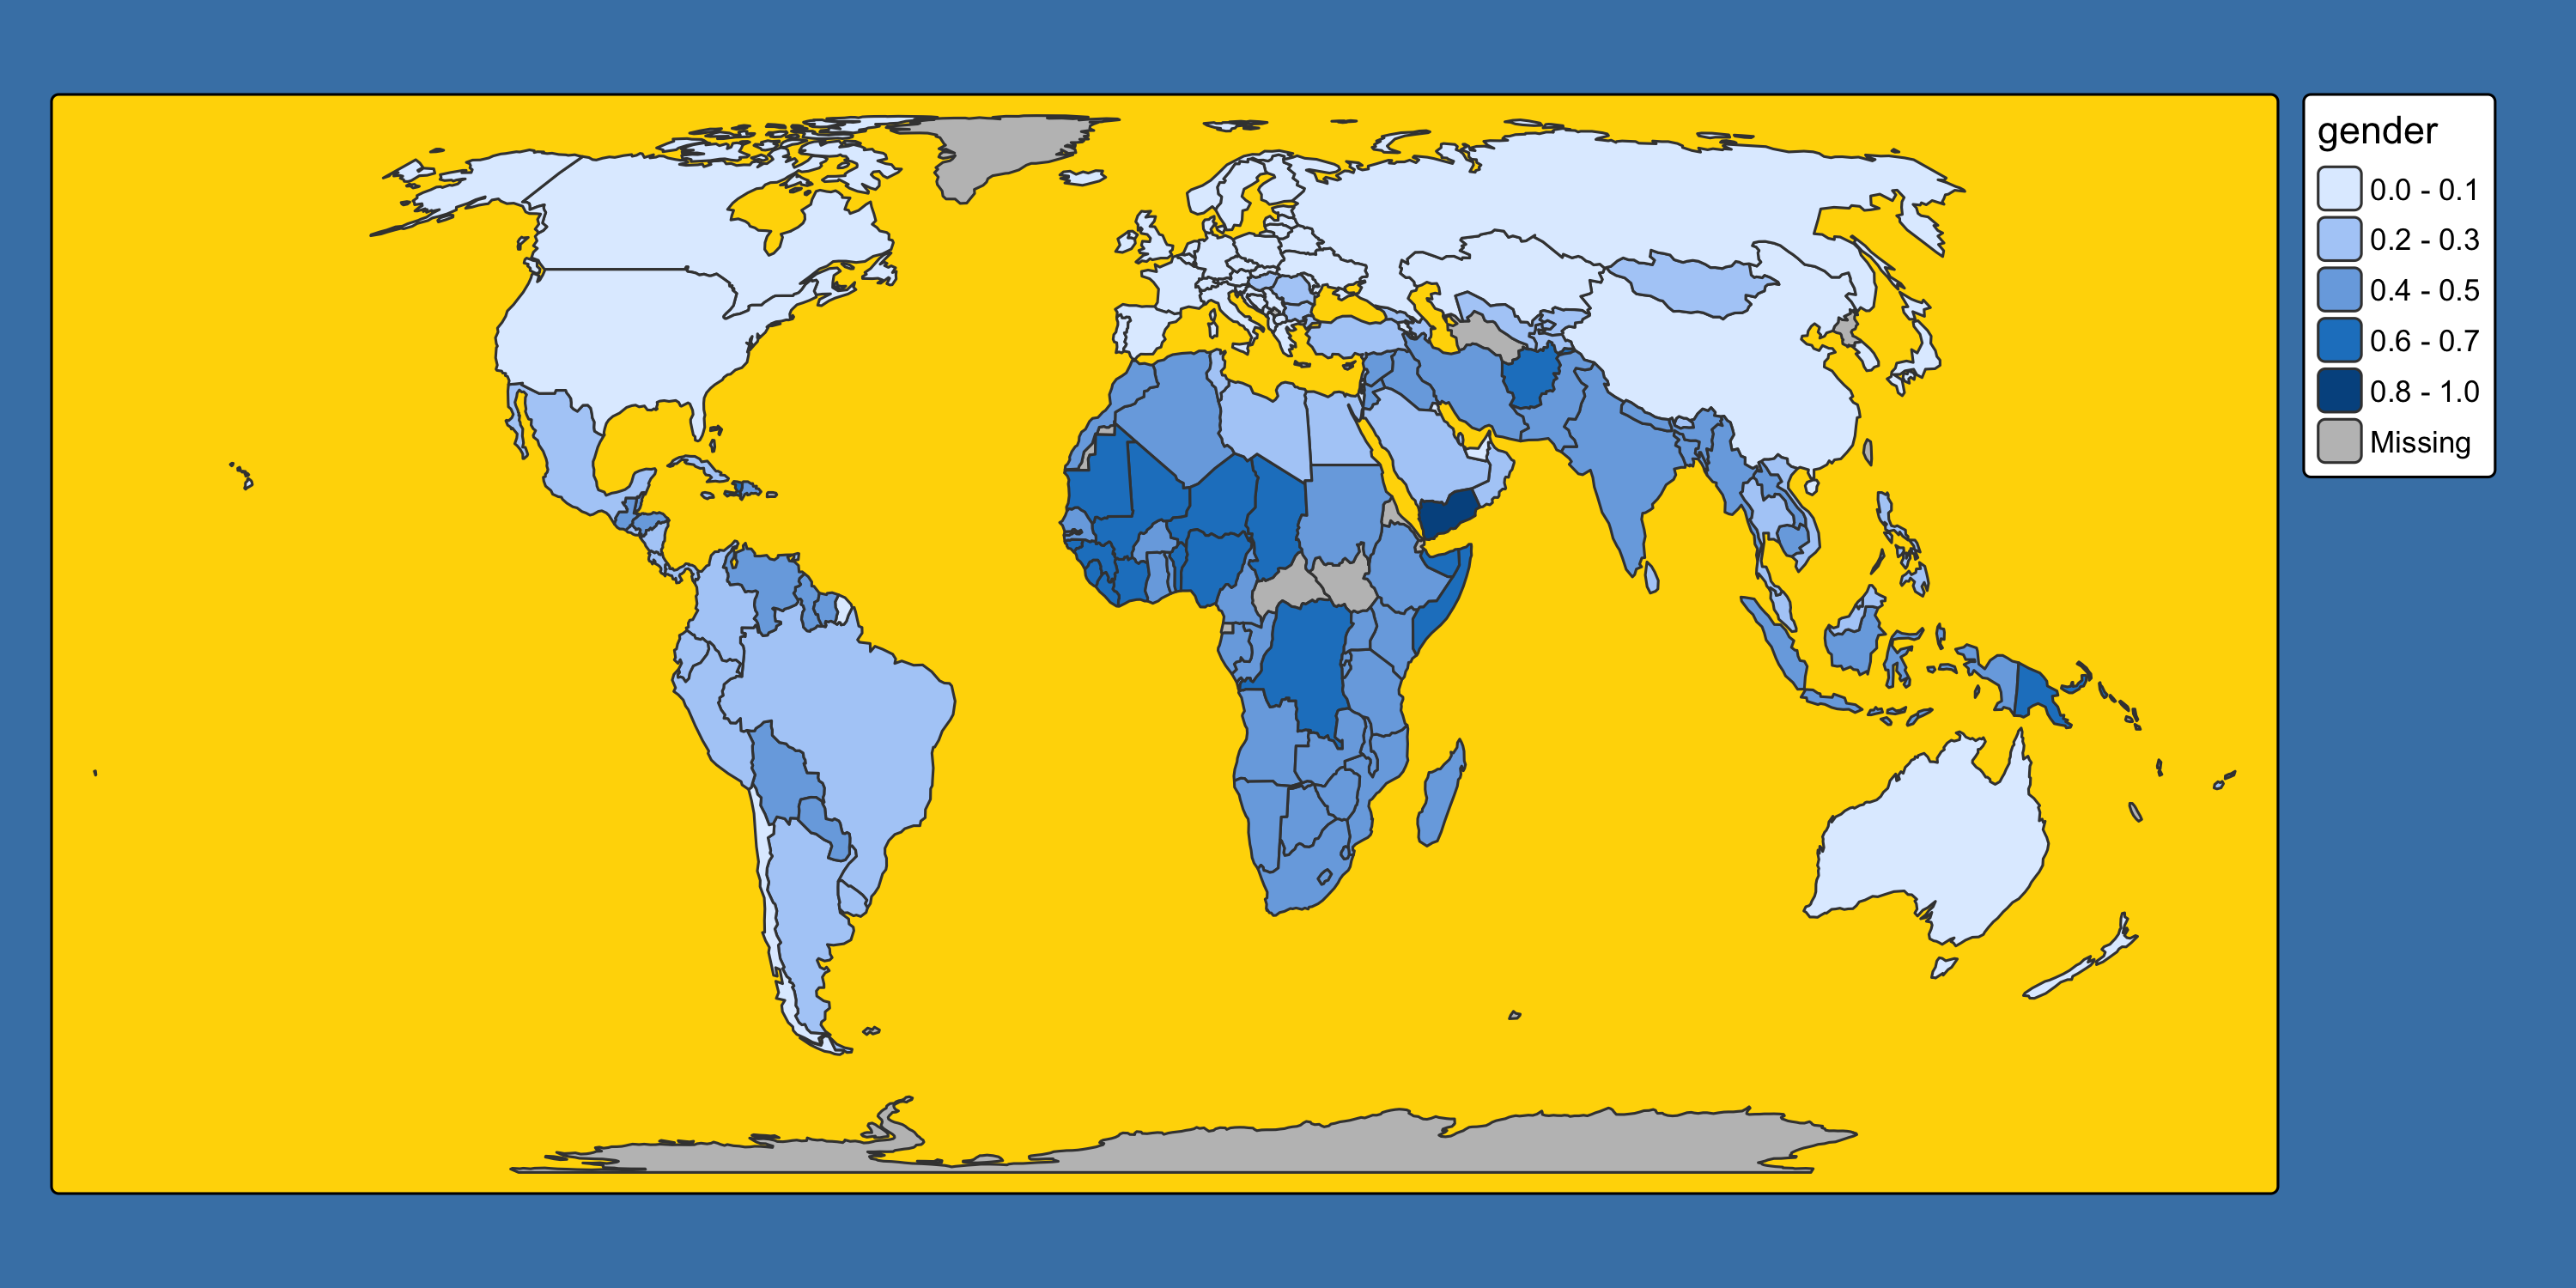
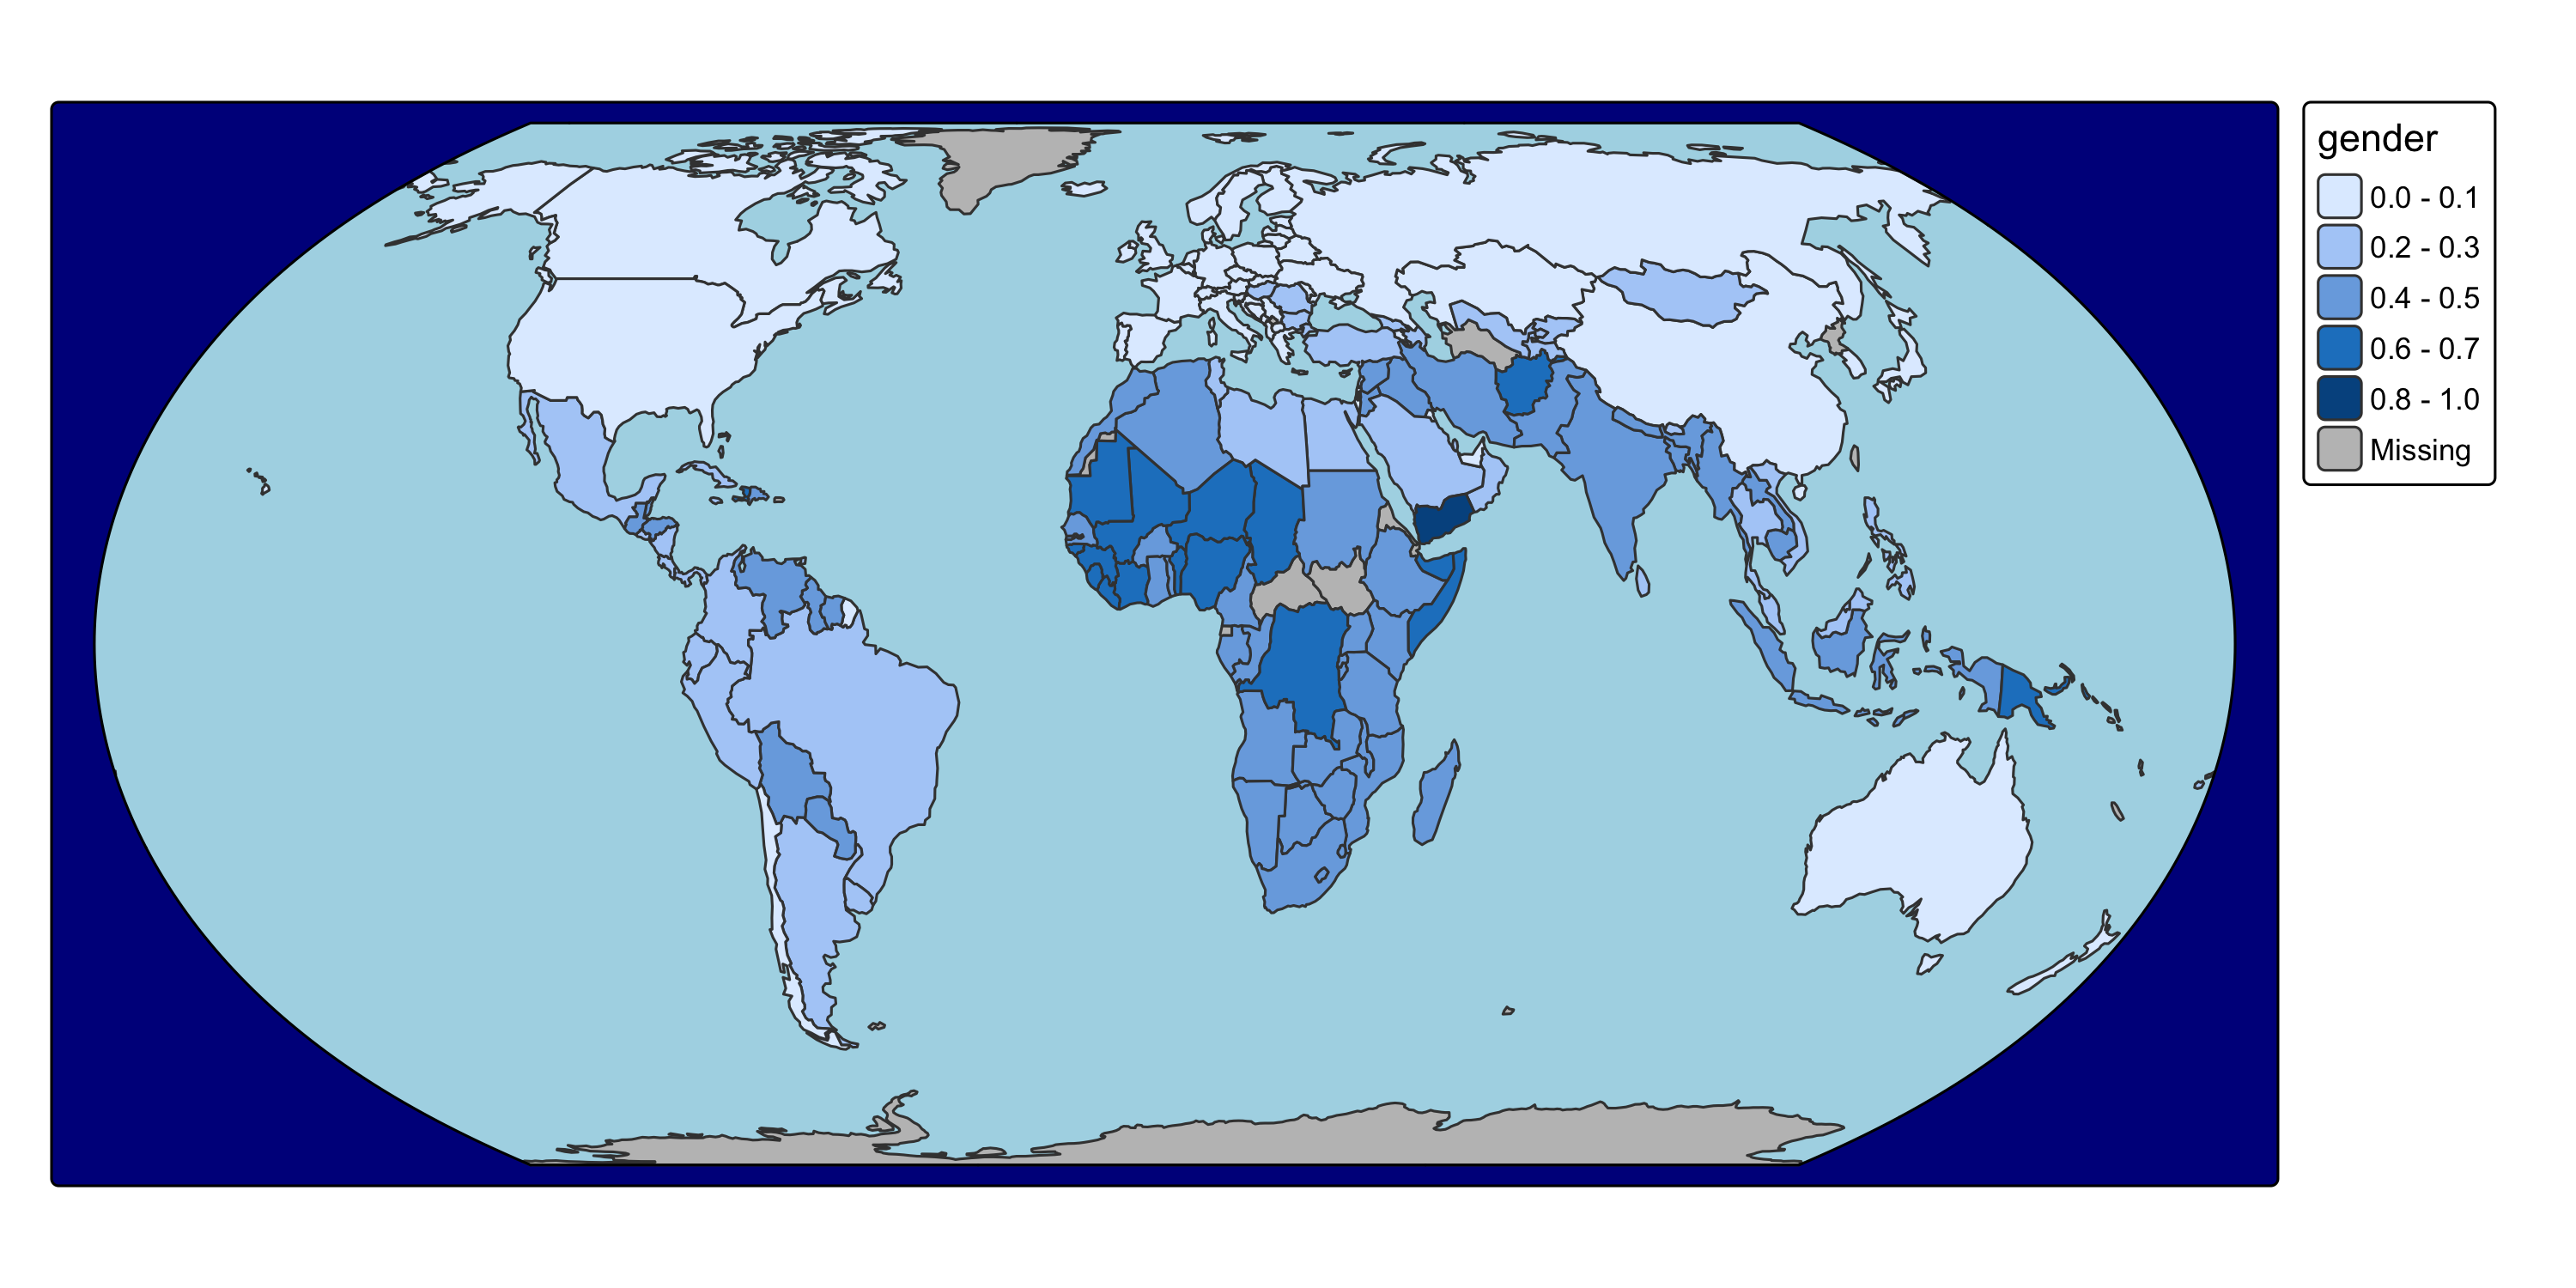
Main method: tm_pos_in() and tm_pos_out()

Arguments: - cell.h and cell.v — which of the 3×3 grid cells (outside or inside the map frame) - pos.h and pos.v — position within that cell - just.h and just.v — justification when pos is numeric - align.h and align.v — alignment when multiple components share a cell

3×3 grid: cell.h and cell.v

  • The plot area is a 3×3 grid; the centre cell is the map itself
  • tm_pos_in() → places inside the map frame (centre cell)
  • tm_pos_out() → places outside (any of the 8 surrounding cells)
tm_shape(NLD_muni) +
  tm_polygons("grey85", col = "grey60") +
tm_compass(position = tm_pos_in(pos.h = "center", pos.v = "center")) +
tm_scalebar(position = tm_pos_out("left", "center", pos.v = "center")) +
tm_title("Title", position = tm_pos_out("right", "top")) +
tm_credits("Credits", position = tm_pos_out("center", "bottom", pos.h = "center")) +
tm_layout(asp = 1, frame.color = "blue", frame.lwd = 2)

Position in a cell: pos.h and pos.v

0 = left/bottom corner, 1 = right/top corner

Position in a cell: just.h and just.v

When pos is numeric: which corner of the component anchors at that point.

Grouping components with tm_components()

Via group_id and tm_components() multiple components can be positioned together:

tm_shape(NLD_muni) +
  tm_polygons("income_high",
    fill.legend = tm_legend("High income households",
                            group_id = "A")) +
tm_compass(group_id = "B") +
tm_scalebar(breaks = c(0, 10, 25, 50), group_id = "B") +
tm_components("A", position = c("left", "top"),    frame = TRUE) +
tm_components("B", position = c("left", "bottom"),  frame = FALSE)

Grouping components with tm_components()

Frame and background

Custom frame

tm_shape(NLD_muni) +
  tm_polygons("income_high") +
tm_layout(frame = TRUE,
          frame.color = "purple",
          frame.lwd = 3,
          frame.r = 10)

Custom frame

Background only

tm_shape(NLD_muni) +
  tm_polygons("income_high",
    fill.legend = tm_legend(position = c("left", "top"))) +
tm_layout(frame = FALSE,
          bg = TRUE,
          bg.color = "gold")

Background only

Background and outer background

tm_shape(World) +
  tm_polygons("gender") +
tm_crs("auto") +
tm_layout(bg = TRUE,
          bg.color = "gold",
          outer.bg = TRUE,
          outer.bg.color = "steelblue")

Background and outer background

Earth boundary

For some projections (not all) the earth boundary can be drawn:

tm_shape(World) +
  tm_polygons("gender") +
tm_crs("auto") +
tm_layout(bg = TRUE,
          bg.color = "lightblue",
          outer.bg = FALSE,
          earth_boundary = TRUE,
          space.color = "darkblue")

Earth boundary

Panels

tm_shape(World) +
  tm_polygons("gender",
    fill.legend = tm_legend(title = "")) +
tm_crs("auto") +
tm_layout(
  panel.labels = "Gender Inequality Index",
  panel.label.bg.color = "pink")

Panels

Options and styles

Setting tmap options globally

  • Global options can be get and set via tmap_options()
opt = tmap_options()
library(lobstr)
tree(opt)

Setting tmap options map-wise

  • Via tm_options() — options per map
  • tm_layout() — layout-specific options (background, frame, …)
  • tm_plot() and tm_view() — mode-specific options

Styles

A style is a saved set of options. The default style is "white".

tmap_style()                   # check current style
tmap_style("cobalt")           # set globally
tmap_options_save("my_style")  # save your own
tm_shape(World) +
  tm_polygons("gender") +
tm_style("cobalt")

Styles

Components in view mode

What actually works in view mode?

In view mode, components behave differently:

  • No outside-map placementtm_pos_out() is not available; all positions are corners of the map
  • Use the shortcut: position = c(h, v), where h is "left" or "right" and v is "top" or "bottom"
  • The useful components for view mode are:
Component What it does
tm_title() Map title in a corner
tm_scalebar() Distance scale in a corner
tm_minimap() Overview/locator map (Leaflet only)
tm_mouse_coordinates() Live lat/lon display under cursor

tm_minimap() — overview locator

A small overview map shown in one corner, useful to give geographic context when zoomed in:

tmap_mode("view")

tm_shape(NLD_muni) +
  tm_polygons("population") +
tm_minimap(position = c("left", "bottom"),
           toggle = TRUE,        # collapsible
           minimized = FALSE)

Only available in "view" mode (Leaflet).

tm_mouse_coordinates()

Shows the current mouse position as latitude/longitude in a corner:

tmap_mode("view")

tm_shape(World) +
  tm_polygons("HPI") +
tm_mouse_coordinates(position = c("right", "bottom"))

Only available in "view" mode.

tm_title() and tm_scalebar() in view mode

Both work in view mode with simple corner positioning:

tmap_mode("view")

tm_shape(NLD_muni) +
  tm_polygons("population",
              hover = "name") +
tm_title("Dutch municipalities",
         position = c("left", "top")) +
tm_scalebar(position = c("left", "bottom"))

No tm_pos_out(), no grid system — just the four corners.

Recap

  • Map components have no geographic location — they can be placed anywhere
  • Most advanced positioning (tm_pos_out, insets, charts, frames) is plot-mode only
  • For view mode: use tm_title(), tm_scalebar(), tm_minimap(), tm_mouse_coordinates()
  • In view mode all positions are corners: c(h, v) where h is "left"/"right" and v is "top"/"bottom"
  • tm_components() groups components for joint positioning in plot mode
  • Further reading: basics_components | adv_positions | adv_comp_group