library(tmap)
(tm = tm_shape(World) + tm_polygons("press") + tm_crs("auto"))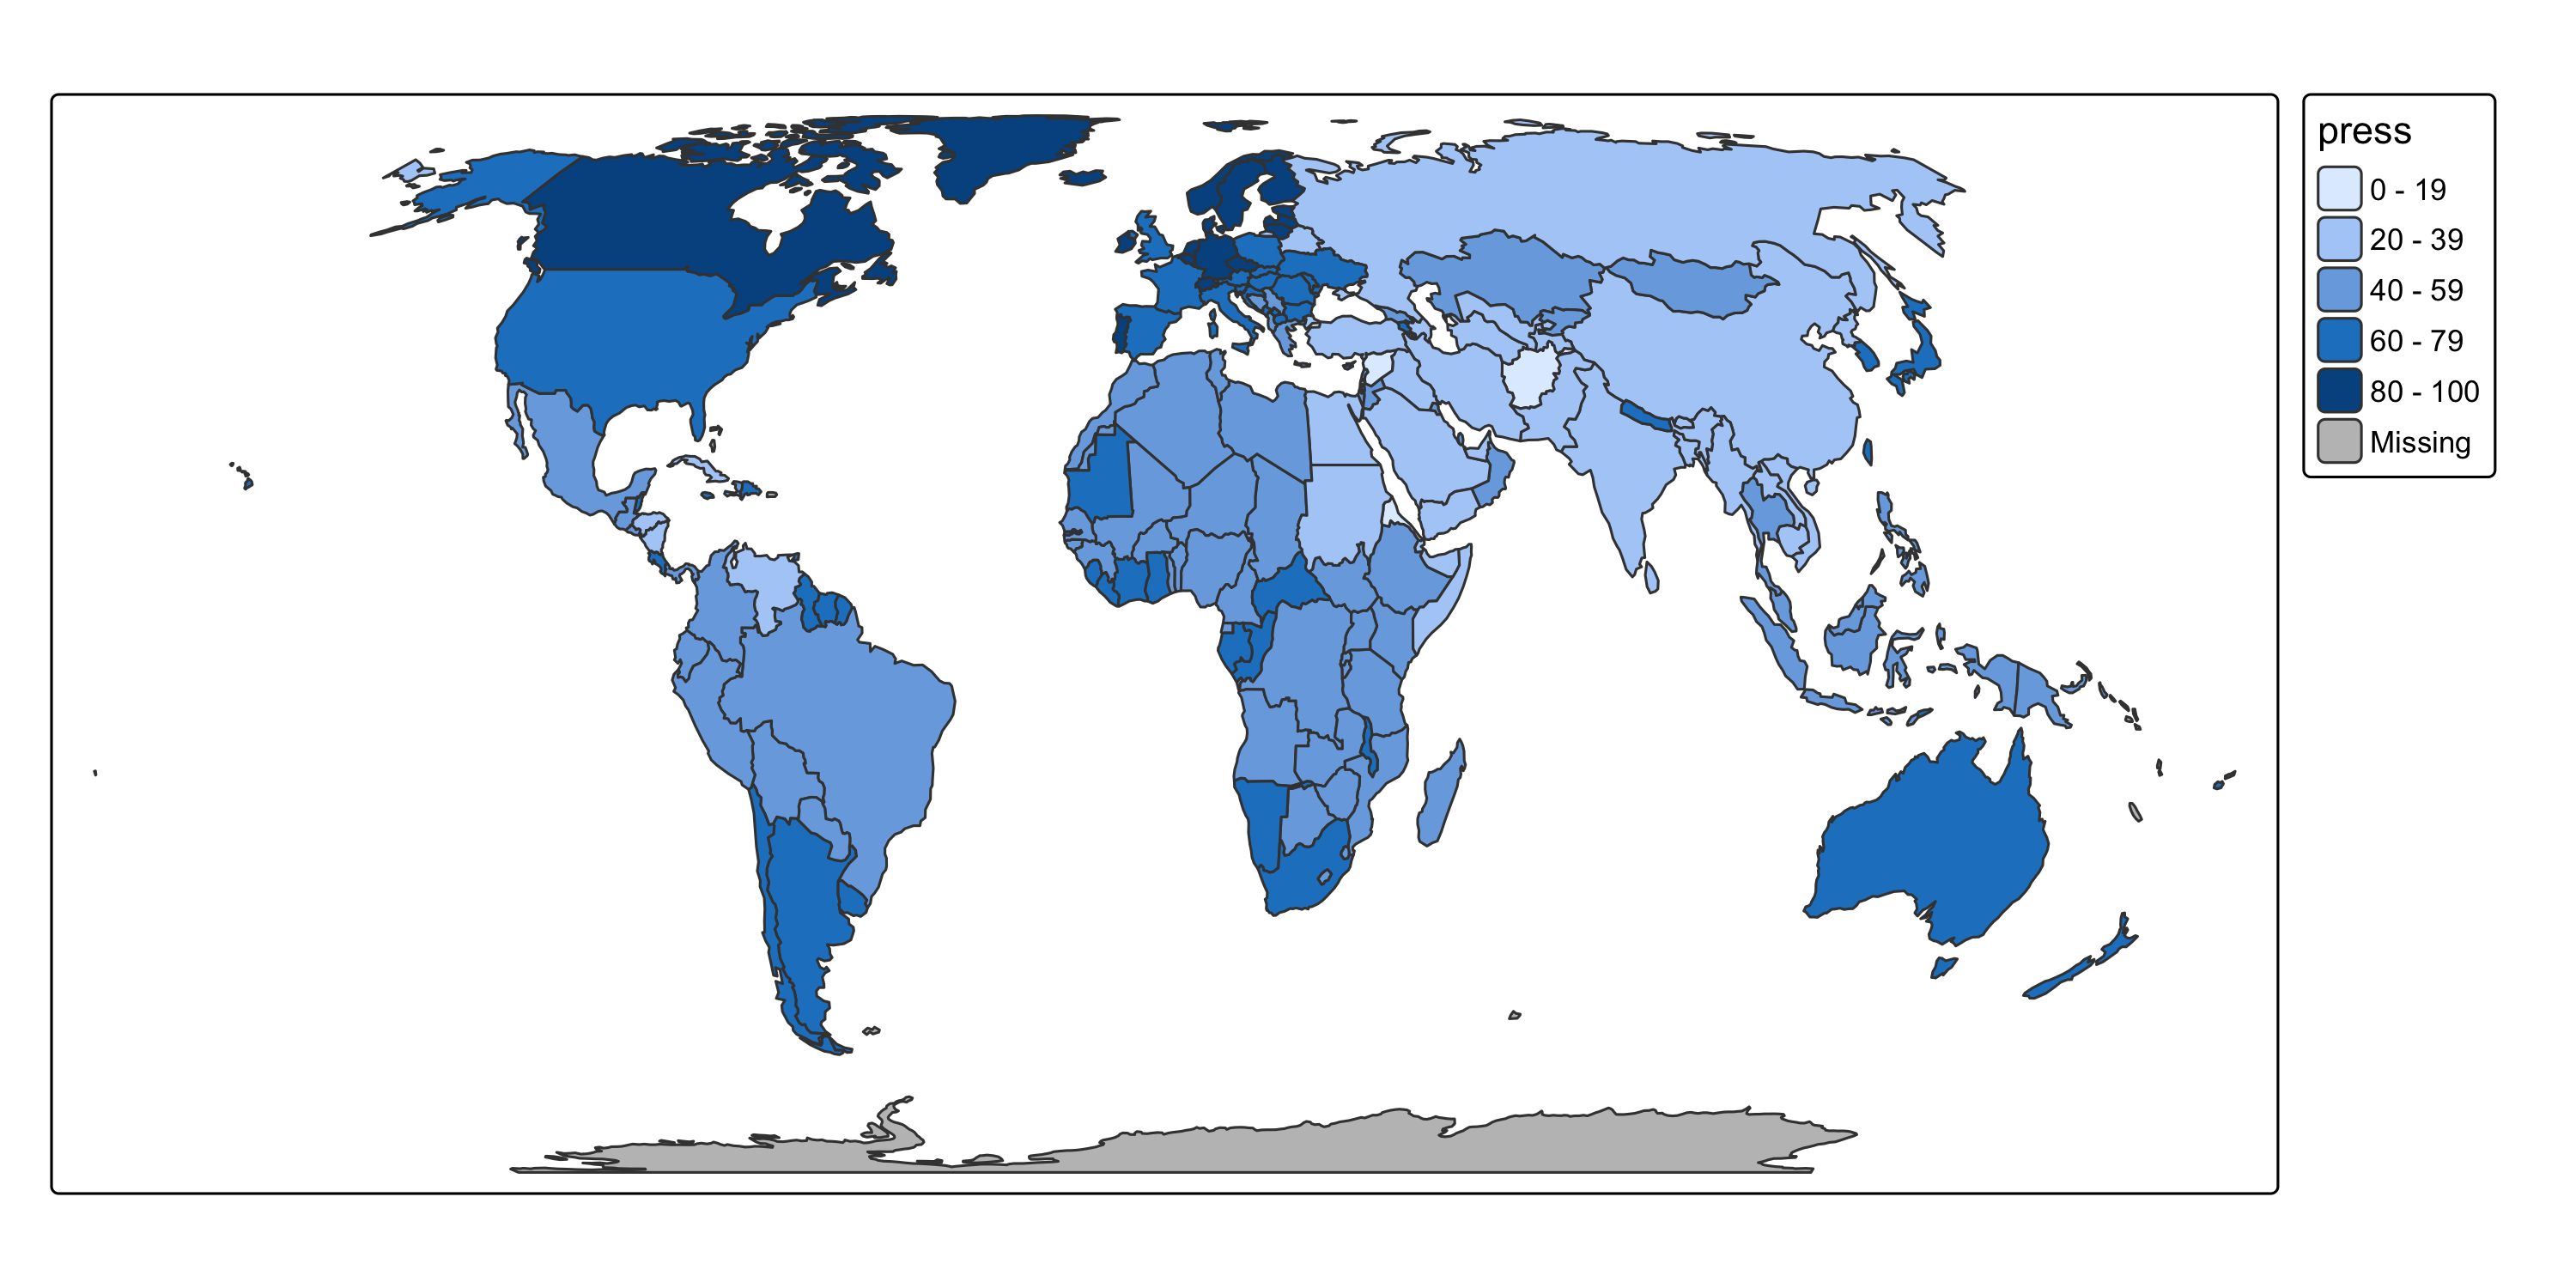
Session 10: Exporting and sharing interactive maps
tmap_save()height and width can be set in pixels or inchesdpi is used to convert thempng() and pdf()type rendering output type, "cairo-png" is the default for png.colormodel "srgb" is the default for, but for high print quality, a "cmyk" (cyan, magenta, yellow, black) is often required.Use scale to increase or decrease scalable viusal elements, like font size and line width
tmap_save()Use the .html extension to save a standalone interactive HTML file — the map can be opened in any browser, no R needed.
"view", "maplibre", or "mapbox", the interactive map is saved"plot", tmap switches to "view" mode automatically for the HTML exportin.iframe places the map in an iframe, which is a html container.selfcontained (default TRUE) determines if dependencies (JS, CSS etc) are included in the filetm_animate()Animations work like facets — replace tm_facets() with tm_animate() to get frames instead of panels. By default the animation plays in the RStudio Viewer pane:
tmap_animation()Save to GIF or MP4 with tmap_animation():
fps is set in tm_animate(); tmap_animation() controls the file format and frame size/resolution (width, height, dpi).
More: adv_animations vignette
tmap_save(tm, "map.png") — save a static map (PNG, PDF, SVG, …)tmap_save(tm, "map.html") — save a standalone interactive HTML file
"view", "maplibre", "mapbox") save as-is; "plot" mode switches to "view" automaticallyselfcontained = TRUE (default) — all JS/CSS bundled in the HTML filetm_animate(fps = 4) — creates an animation (frames instead of facet panels); fps set heretmap_animation(m, "anim.gif") — exports to GIF or MP4; controls frame size/resolution (width, height, dpi)